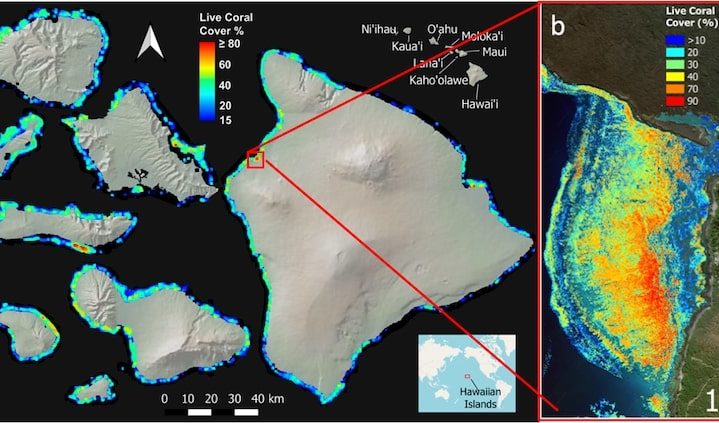
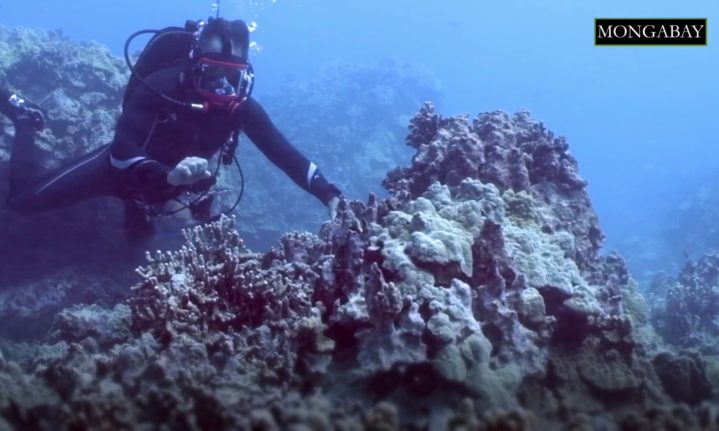
In a newly released map, the coastal waters of the eight main Hawaiian islands are alight with color. Blue, turquoise, green, yellow, orange and red tinge the islands’ perimeters, each hue representing a different level of live coral cover. Blue means that the surrounding reefs contain less than 10% live coral, while at the other side of the spectrum, red corresponds to 90% live coral.
A team of researchers developed this map to provide an overview of living coral distribution around the main Hawaiian islands. Like many coral reef systems around the world, Hawaiʻi’s reefs, which cover 166,000 hectares (410,000 acres) across the archipelago, have been subjected to a profusion of anthropogenic pressures, including coastal development, pollution, fishing activities, and climate change events like marine heatwaves. Using 3D imaging techniques conducted from the air, the research team scanned the reefs at a water depth of 16 meters (52.5 feet), and identified places where coral cover was either dense or sparse. A study on this mapping technique was published last month in Proceedings of the National Academy of Sciences of the United States of America (PNAS).
‘This is the first time that anywhere on the planet, we’ve been able to map the live coral distribution across an entire archipelago, and at a scale that shows us the relative quality of different reefs over a really large area,’ Greg Asner, the study’s lead author and director of Arizona State University’s (ASU) Center for Global Discovery and Conservation Science (GDCS), told Mongabay. ‘And then that’s the critical step needed to generate new innovations in conservation and management.’
The mapping data was collected by ASU’s Global Airborne Observatory, an aircraft-cum-laboratory that captures 3D images of coral reefs beneath the water using laser-guided imaging spectroscopy and artificial intelligence. This technology allows researchers to gauge which corals are dead and which ones are alive based on two components: a coral’s chemical composition and its spectral properties — that is, a coral’s response to illumination.
‘Live corals and dead corals have fundamentally different chemical properties that are based on the animal itself — the coral animal — and also … the small algae that lives with and inside the coral polyp,’ Asner said. ‘That combination generates a chemical signature that we can see from the air. If that chemical signature is intact, we see it as live coral. If it’s broken down in one way or another, caused by say, coral bleaching or some other effect that drives a coral to die, then it has a different chemical signature and we can see that from the air as well.’
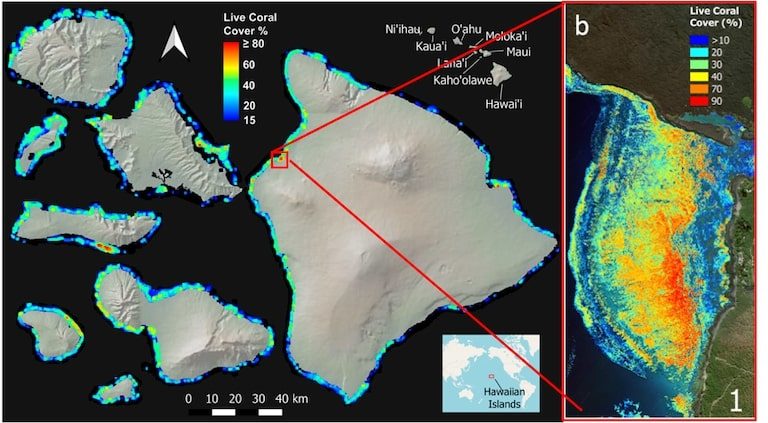
Map showing the percentage of live coral cover at 2-meter spatial resolution to 16-meter depth for the eight main Hawaiian islands. Image by Asner et al.
It took about a month for Asner and his colleagues to map the corals around Hawaiʻi’s archipelago, but more than 20 years to develop and refine the technology to enable this process, Asner said.
The results showed that places such as West Hawaiʻi and West Maui had some of the highest coral cover, while some of the lowest coral cover was in Oʻahu, home to the state capital, Honolulu, and two-thirds of the state’s population. But low coral cover doesn’t always mean that coral is in trouble due to human causes, said co-author Brian Neilson, administrator for the Department of Land and Natural Resources (DNLR) in Hawaiʻi’s Division of Aquatic Resources (DAR). For instance, coral cover could be low in some cases due to sand cover, embayments, or high exposure to wave action and rough seas, he said.
‘The analysis takes these factors into account to help identify areas [in which] low coral cover is driven by human impacts or impacts we can try to mitigate,’ Neilson told Mongabay in an email. ‘Nearshore development was the main human-based factor associated with low coral cover.’
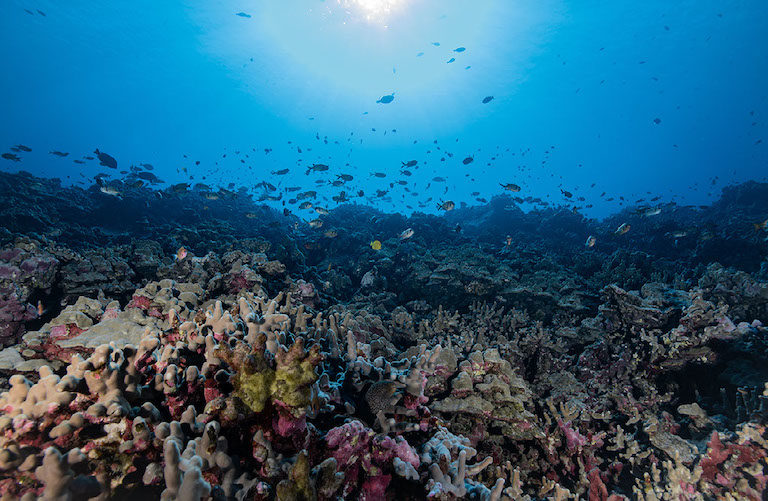
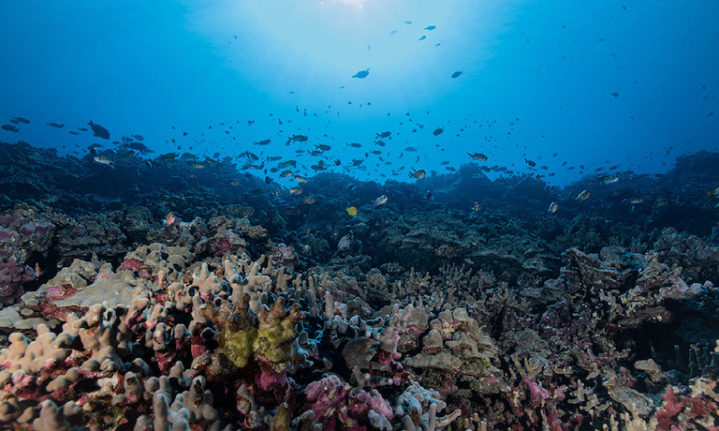
A school of fish swim amongst healthy coral reefs in South Kona, Hawaii Island. Image by Greg Asner, Arizona State University Center for Global Discovery and Conservation Science
The mapping process also revealed places where coral reefs showed resilience to human-driven stressors, referred to as ‘refugia’ in the study.
‘We want to understand what the factors are, environmentally and genetically, for corals themselves that lead to this situation where there are persisting reefs, full of live corals, despite all of these stresses,’ Asner said. ‘These refugia are really critical for us to understand their origin, what maintains them, and what we need to … do to protect them for future generations.’
According to one report, 75% of all coral reefs are currently facing local and global pressures, but nearly all coral reefs will be threatened with extinction by 2050.
In another study co-authored by both Asner and Neilson, Hawaiʻi’s reefs were also found to have lost about half their fish due to pollution, fishing and other anthropogenic pressures, which adds to the stress Hawaiʻi’s reefs are currently facing.
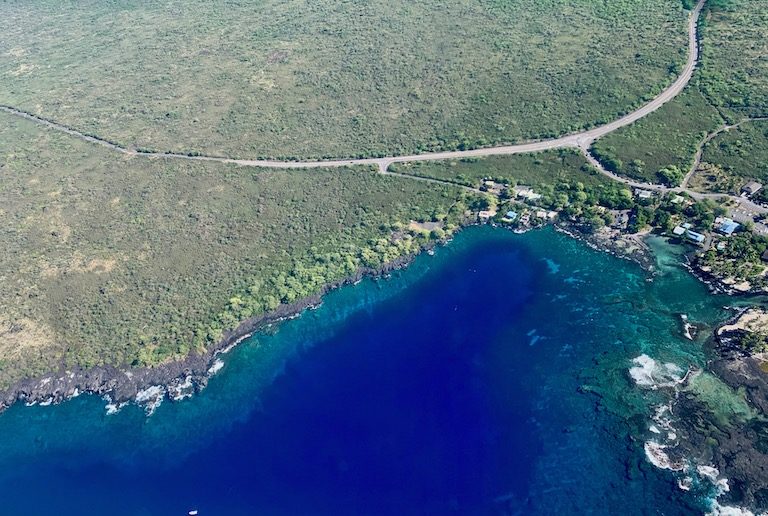
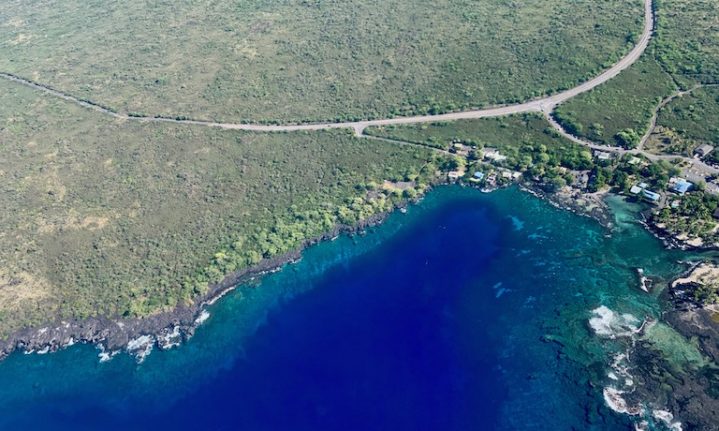
An aerial view of Hawaii’s reefs. Image by Greg Asner.
Neilson says the mapping results will directly influence the DNLR’s marine protection efforts in Hawaiʻi, including the 30 by 30 Oceans Target, intended to protect 30% of Hawai‘i’s coastal waters by 2030.
‘This information will inform management planning [in terms of] designation of marine managed areas, prioritization of restoration sites (ridge to reef), and monitoring fish habitat through the state,’ Neilson said.
‘Mapping helps conservation efforts by literally steering managers and decision makers into the right direction,’ Asner said. ‘Where are you going to apply restoration? Where are you going to apply protection? Those kinds of questions can be answered through this type of mapping.’
Citations:
Asner, G. P., Vaughn, N. R., Heckler, J., Knapp, D. E., Balzotti, C., Shafron, E., … Gove, J. M. (2020). Large-scale mapping of live corals to guide reef conservation. Proceedings of the National Academy of Sciences, 117(52), 33711-33718. doi:10.1073/pnas.2017628117
Foo, S. A., Walsh, W. J., Lecky, J., Marcoux, S., & Asner, G. P. (2020). Impacts of pollution, fishing pressure, and reef rugosity on resource fish biomass in West Hawai‘i. Ecological Applications. doi:10.1002/eap.2213
Source: Mongabay
Picture: screenshot from video


